Prices and purchasing power parities (PPP)
Share of OECD economies in global GDP broadly stable at 46% in 2021 compared to 2017
Download in PDF (tables included)
30 may 2024 - The International Comparison Program (ICP) released its 2021 and revised 2017 results today. The ICP is a worldwide statistical partnership which produces purchasing power parities (PPPs) and comparative price levels for participating economies to compare their size of Gross Domestic Product (GDP) and its main components internationally, taking account of differences in price levels.
The economies of the current 38 OECD member countries accounted for about 46% of world GDP in 2021, broadly stable compared to 48% in 2017 (Figure 1). More generally, shares of regions in world GDP did not change substantially between 2017 and 2021.
In 2021, China, the United States and India continued having the biggest GDP in the world, representing 19%, 15.5% and 7.2% of world GDP, respectively, expressed in PPPs (Figure 2 and Table 1). Within the OECD, the distribution of countries remained broadly the same between 2017 and 2021, with the United States, Japan, Germany, France, and the United Kingdom being the largest OECD economies (Figure 3).
In terms of GDP per capita, Luxembourg remains the leader among OECD countries with 138 000 USD PPP in 2021, which reflects, however, a large share of cross-border workers. Some countries ranked lower relative to their OECD peers in 2021 compared to 2017. For instance, Iceland moved from the group of top six to a significantly lower position and Japan and Spain’s per capita GDP moved from around the median to around the lower third of OECD countries (Figure 4). On the other hand, Czechia, Slovenia, and Lithuania moved up, closer to OECD median.
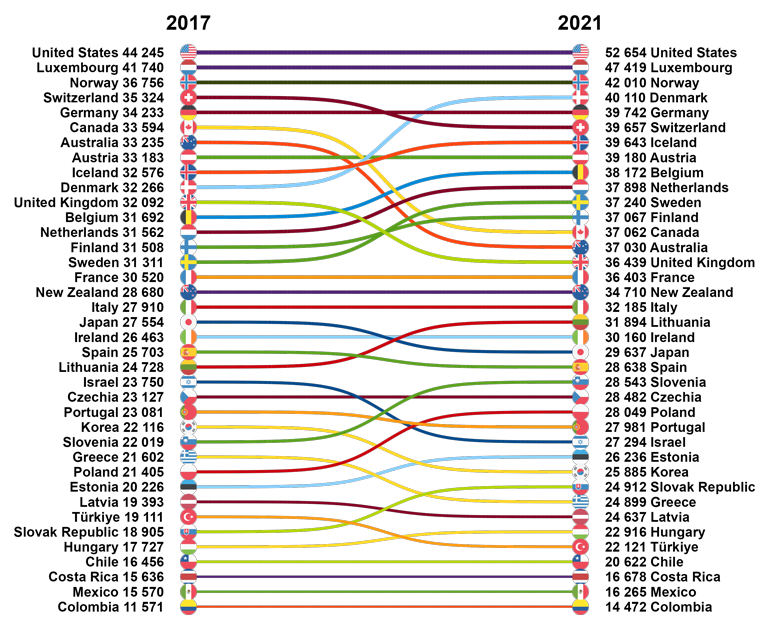
In terms of Actual Individual Consumption (AIC) per capita, a better-suited measure of material welfare covering goods and services consumed by households, the United States remained the top OECD country in 2021 with almost 53 000 USD PPP, followed by Luxembourg and Norway. Compared to 2017, some Nordic countries, notably Denmark and Sweden, as well as some Central and Eastern European countries e.g., Lithuania, Slovenia or Poland moved up relative to other OECD countries in 2021. Canada, Australia, the United Kingdom, Israel, and Greece, on the other hand, moved further away from top OECD performers in 2021.
GDP price level indices, i.e., ratios of PPPs to a country’s exchange rate and indicators of a country’s relative price level, were higher than world average in 24 OECD countries in 2021 (Table 1). This means that these countries were more expensive than average world country.
Figure 1 – Share in world GDP by region, revised 2017 and new 2021 results
|
|
Note: The OECD region for all periods contains the current 38 OECD member countries, as of May 2024. The non-OECD countries participating in ICP are divided into regional groups according to the country groupings used by the World Bank (except Bermuda that is assigned to the Latin America and Caribbean region) available here: https://datahelpdesk.worldbank.org/knowledgebase/articles/906519-world-bank-country-and-lending-groups. Source: 2021 International Comparison Program, OECD PPP database, OECD calculations. |
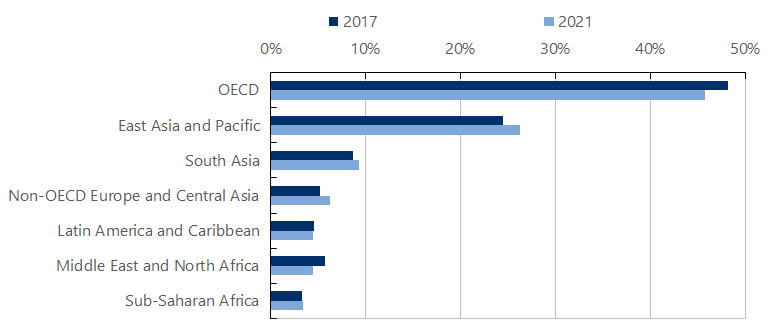
Figure 2 – Share in world GDP in 2021, world regions and biggest economies
|
|
Note: Only countries with share in world GDP of at least 1.2% are shown. |
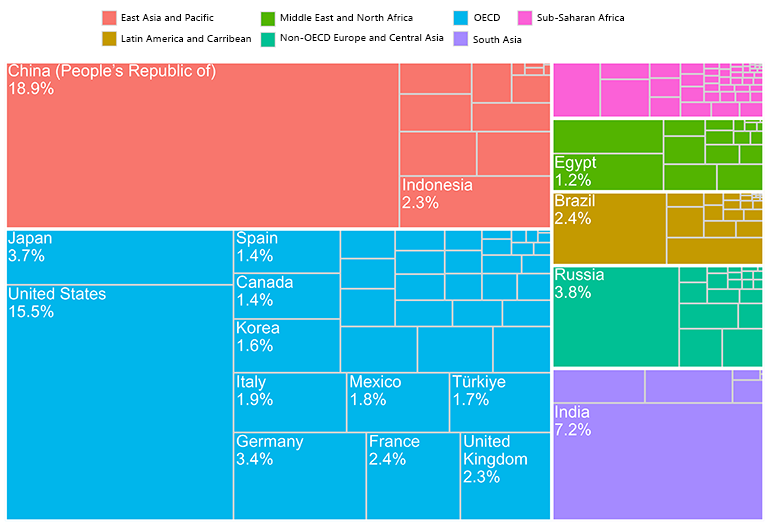
Figure 3 – Gross Domestic Product in OECD countries, revised 2017 and new 2021 results
|
|
Note: the countries are shown ranked according to their GDP in USD PPP, from highest (top) to lowest (bottom). However, due to the level of uncertainty associated with the basic price and national accounts data, and the methods used for compiling PPPs, the differences between countries that have results within a close range should not be over-interpreted. The thickness of connector lines is broadly proportional to countries’ GDP in bn USD PPP. |
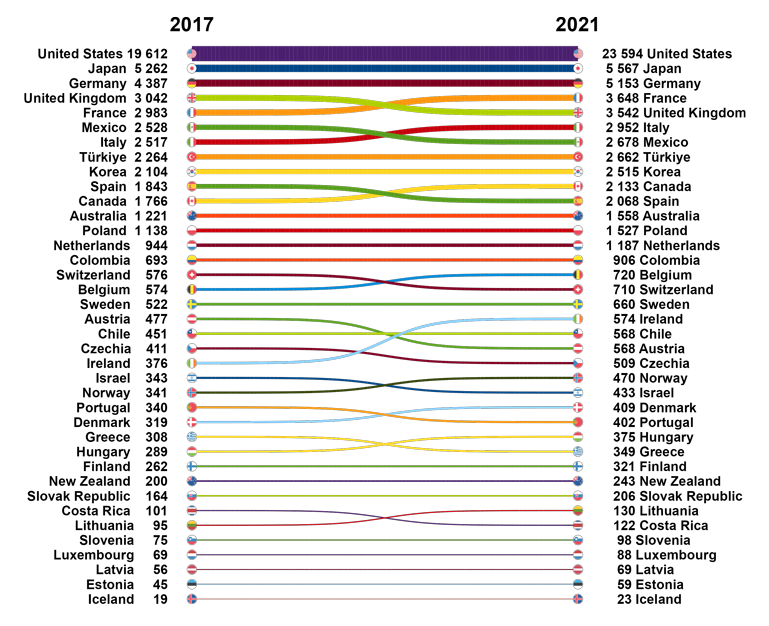
Figure 4 – Gross Domestic Product per capita in OECD countries, revised 2017 and new 2021 results
|
|
Note: the countries are shown ranked according to their GDP per capita in USD PPP, from highest (top) to lowest (bottom). However, due to the level of uncertainty associated with the basic price and national accounts data, and the methods used for compiling PPPs, the differences between countries that have results within a close range should not be over-interpreted. The thickness of connector lines is broadly proportional to countries’ GDP per capita in USD PPP. Source: 2021 International Comparison Program, OECD PPP database, OECD calculations. |
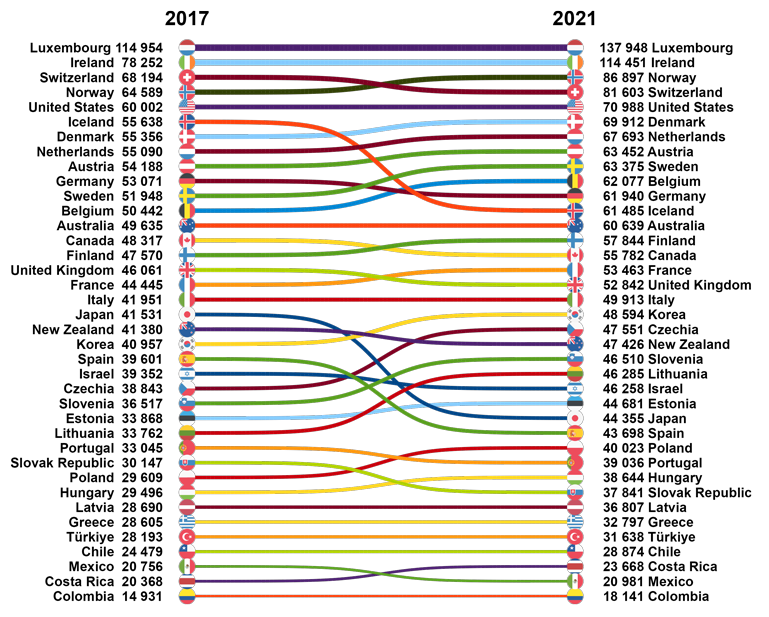
Figure 5 – Actual Individual Consumption in OECD countries, revised 2017 and new 2021 results
|
|
Note: the countries are shown ranked according to their AIC per capita in USD PPP, from highest (top) to lowest (bottom). However, due to the level of uncertainty associated with the basic price and national accounts data, and the methods used for compiling PPPs, the differences between countries that have results within a close range should not be over-interpreted. The thickness of connector lines is broadly proportional to countries’ AIC per capita in USD PPP. Source: 2021 International Comparison Program, OECD PPP database, OECD calculations. |
Information about the International Comparison Program (ICP) and the Eurostat-OECD PPP Programme:
The ICP is a worldwide statistical partnership with the aim to produce purchasing power parities (PPPs) and comparative price levels for participating economies that make it possible to compare economic output and material welfare across countries. PPPs are estimated using prices of items of a common and comprehensive basket of goods and services, and expenditure shares on groups of items in each country. Hence, they are a conversion rate that controls for different price levels across countries. The Eurostat-OECD Programme is part of the ICP, producing and disseminating results for 48 EU and OECD member countries and for their associate non-member countries. At present, the OECD part of the programme covers 12 member countries: Australia, Canada, Chile, Colombia, Costa Rica, Israel, Japan, Korea, Mexico, New Zealand, the United Kingdom and the United States. In addition to their Programme countries, the Eurostat-OECD also supported the participation of Georgia and Ukraine in the ICP.
Along with the release of 2021 PPP results, the results for previous reference year 2017, as well as 2018-2020 estimates have been revised.
Due to the level of uncertainty associated with the basic price and national accounts data, and the methods used for compiling PPPs, the differences between countries that have results within a close range should not be over-interpreted.
Useful links
> International Comparison Program
> Purchasing Power Parities: Frequently Asked Questions
> OECD Detailed PPP results database, 2020 onwards
> New purchasing power parities reveal large relative cost of living difference across the OECD in 2022 (10 April 2024, Blog article)
> Purchasing Power Parities at Eurostat
Contacts
For further information contact the OECD's Media Relations Division on (33) 1 45 24 97 00; for further information on data contact OECD’s Statistics and Data Directorate.
Related Documents