National accounts
Tax revenue in the pandemic
Growth and tax revenue are usually linked
02 Mar 2022 - In 2020, Gross Domestic Product (GDP) declined in most OECD countries as a consequence of the COVID-19 pandemic. Declining GDP tends to be accompanied by a fall in tax revenue because most tax liabilities are based either directly or indirectly on production in the economy, i.e. taxes on profits, wages or sales of goods and services. Governments strive to avoid slowdowns in part because they hit the fiscal balance and lead to lower spending capacity or increased borrowing.
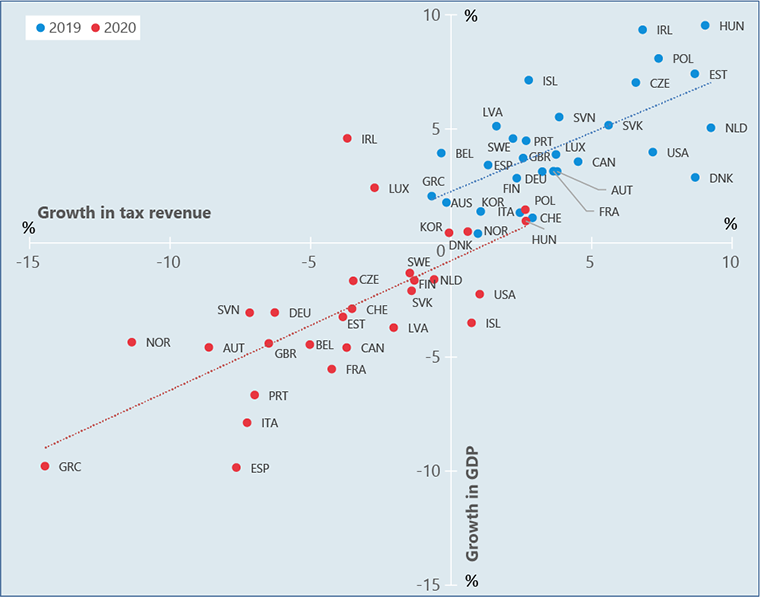
The correlation between tax revenue and the growth of economies can be observed by placing countries on a graph showing changes in tax revenue and GDP (Figure 1). In a conventional year such as 2019 (the blue dots), almost all OECD countries sit in the upper right quadrant reflecting both positive growth in GDP (the Y-axis) and in tax revenue (the X-axis).
The correlation between the two indicators appears again when the same exercise is done for 2020 (the red dots). GDP fell as the pandemic hit, and this resulted in declining tax revenue in most OECD countries – so most appear in the bottom left quadrant. Only six countries recorded positive tax revenue growth in 2020. Of these, four also recorded positive growth in GDP, although less than in 2019. Iceland and the United States were the only OECD countries to record positive growth in tax revenue for 2020 while reporting a decline in GDP.
Figure 1: Total tax revenue and GDP in OECD countries, annual growth, 2019 and 2020
Source: OECD (2022) Annual National Accounts - Gross domestic product (GDP) and Government deficit/surplus, revenue, expenditure and main aggregates (Databases) Note: 2020 taxation data for Chile, Colombia, Japan, Mexico, New Zealand, and Turkey is not currently available. Australia operates with a July to June financial year and therefore growth recorded for Australia is from Q3-2018 to Q2019 and Q3-2019 to Q2-2020. The blue (red) dotted ‘best fit’ line, which slopes upwards, shows that in general an increase (decrease) in GDP is likely to result in an increase (decrease) in tax revenue. |
In 2020 production taxes fell more than income and wealth taxes…
GDP is the most well-known macro-economic indicator within the national accounts, but the System of National Accounts 2008 (SNA) provides a framework to map most transactions, including taxes,1 between sectors of the economy. The SNA classifies taxes into two distinct categories: Taxes on production and Current taxes on income and wealth:2
-
Taxes on production include any tax that is “payable per unit of some good or service” or any taxes that “enterprises incur as a result of engaging in production [excluding any taxes on the profits]”. Therefore, taxes on production are either explicitly linked to the amount of production occurring (the number of units being produced, sold, consumed) or are payable simply because the production is occurring, with no connection to profitability. The best known examples of taxes on production are value added tax (VAT) and sales tax.
-
Current taxes on income and wealth consist of “taxes on the incomes of households or profits of corporations and of taxes on wealth that are payable regularly every tax period”. These taxes are indirectly linked to production because incomes of households and profits of corporations are the monetary return on labour and capitals’ input into production.
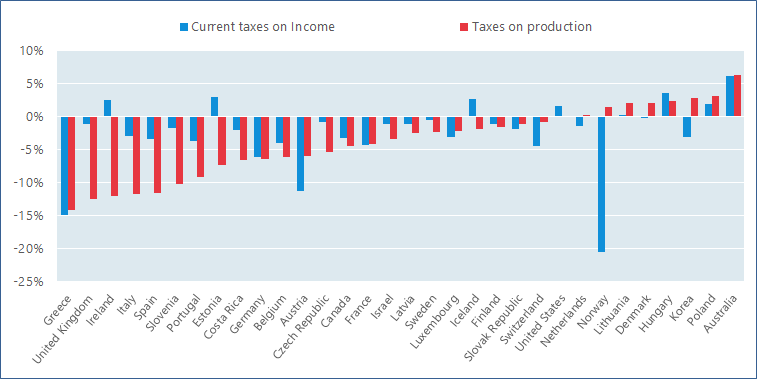
Figure 2: Taxes on production and current taxes on income and wealth in OECD countries, annual growth, 2020 Source: OECD (2022), Annual National Accounts - Government deficit/surplus, revenue, expenditure and main aggregates (Database) Note: 2020 taxation data for Chile, Colombia, Japan, Mexico, New Zealand, and Turkey is not currently available. Australia operates with a July to June financial year and therefore growth recorded for Australia is from Q3-2018 to Q2019 and Q3-2019 to Q2-2020. |
In 2020 taxes on production fell more than current taxes on income and wealth in most OECD countries (Figure 2). In fact, of the 25 countries which experienced a difference of more than one percentage point between these indicators, 17 recorded a larger decline in production taxes than current taxes. This is likely due to the lockdowns and other public health restrictions that were initiated at the onset of the pandemic, reducing households’ consumption of goods and services and restricting movement of people. VAT and excise duties on specific goods and services (such as alcohol and gasoline) are examples of production taxes that fell in the second quarter of 2020.
At the same time, in 2020 many governments subsidised businesses to maintain employment and wage levels. This meant that even though some employees had to reduce their hours or not work at all for prolonged periods of time, the decline in revenue from taxes on profits of corporations and incomes of households was more limited than might have been expected. The exceptions were Norway, Austria and Greece. Norway recorded a decline in current taxes of 20.5% although current taxes on incomes of the household sector actually rose in 2020 (see Figure 3). This decline reflected a temporary drop in corporate tax revenue collected from oil and gas companies due to the impact of falling oil prices over 2020. The fall in current taxes in Austria (minus 11.3%) was probably due to a reduction in income tax rates for low earners combined with a generous tax deferral program, which allowed payments to be put off until 2021. Greece experienced a 9.8% fall in GDP (jointly with Spain, the biggest contractions among OECD economies) and sharp falls in both current taxes and taxes on production.
… and taxes paid by the household sector fell less than in 2009
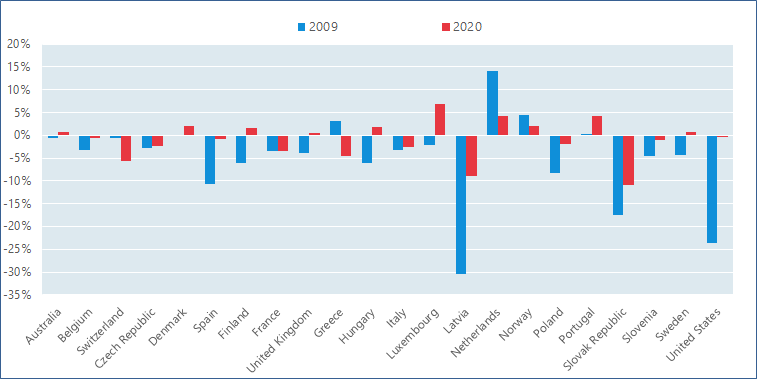
When compared with the global financial crisis in 2009, the pandemic in 2020 had a smaller impact on income taxes paid by the household sector (Figure 3).3 Of the 22 countries where data is available for both 2009 and 2020, 17 recorded a better outcome for current taxes in 2020 than in 2009, despite GDP for the OECD area falling more in 2020 (-4.6%) than in 2009 (-3.4%).
Figure 3: Current taxes on income and wealth paid by the household sector in OECD countries, annual growth, 2009 and 2020 |
Governments undertook expansionary fiscal policies in 2009, but policies supporting jobs and wages were not as widely used as in 2020. While the long-term effects of the employment support packages put in place in 2020 are yet to be fully understood, it appears that one clear result was to curb the decline in income taxes paid by the household sector produced by the economic downturn.
Further information
Additional information and estimates on the different taxation classifications included in the national accounts are available in the OECD data warehouse.
Analysis on recent trends in government revenue is available in Revenue Statistics 2021, published by the Centre for Tax Policy at the OECD. Although compiled on a different basis to the national accounts, this report compares government revenue in 2020 with 2009, during the global financial crisis.
Contact
For further information, please contact the OECD Statistics and Data Directorate at stat.contact@oecd.org.
 |
Follow us @OECD_Stat |
1. Within the SNA taxes are defined as “compulsory, unrequited payments, in cash or in kind, made by institutional units to government units”.
2. A third category also exists within the SNA: capital taxes. This category includes “taxes levied at irregular and infrequent intervals on the values of the assets or net worth owned by institutional units or on the values of assets transferred between institutional units as a result of legacies, gifts, or other transfers”. However, since “irregular and infrequent” excludes any taxes paid on a regular annual basis, as a proportion of total taxes collected, capital taxes make up a small fraction for most countries. For the purpose of this analysis, capital taxes have been included with current taxes.
3. Within the SNA, current taxes on income and wealth paid by the household sector do not include compulsory social security contributions. Unlike conventional taxes, such contributions usually confer an entitlement to receive a (contingent) future social benefit. However, because of their compulsory nature some publications (including the OECD’s Revenue Statistics 2021) include social security contributions in aggregate estimates of taxes paid.
Related Documents


