Tax policy analysis
Taxing Energy Use: A Graphical Analysis
What has changed?
Find out in the new Taxing Energy Use 2018
About the publication
|
Publication Date: Pages: 256 |
The taxation of different sources and uses of energy (particularly those that give rise to emissions of greenhouse gases) will play a key role in governments’ efforts to mitigate the scale of global warming and climate change. At present, effective tax rates vary widely across different sources and uses of energy within countries, as well as across countries. This publication provides the first systematic statistics of such effective tax rates - on a comparable basis - for each OECD country, together with ‘maps’ that illustrate graphically the wide variations in tax rates per unit of energy or per tonne of CO2 emissions. These statistics and maps should be an invaluable tool for policymakers, analysts and researchers considering both domestic fiscal reform in response to climate change and other environmental challenges (e.g. to achieve emissions reductions targets most cost-effectively) and wider international responses. |
Press release
28/01/2013: OECD calls for better alignment of energy policy, public finances and environmental goals
Summary
Review the Executive Summary of Taxing Energy Use.
The Overview section of Taxing Energy Use provides background information on energy taxation, explains the structure of the country graphs or 'maps' and the methodology used, and sets out a cross-country summary of the results of the analysis.
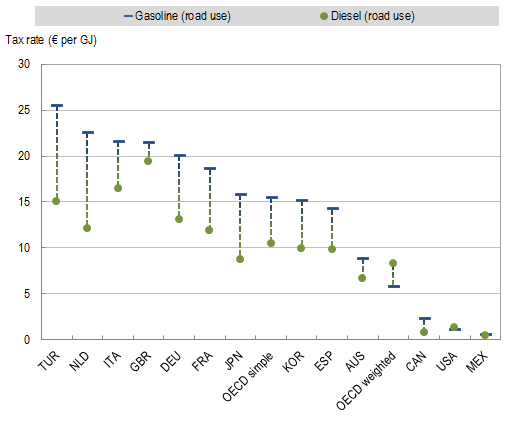
The report calculates what statutory tax rates on diverse fuels imply in terms of taxation per unit of energy and per unit of carbon dioxide (CO2) emissions. There are wide variations in these effective tax rates across countries. In many countries, these rates also vary widely between different types of fuel (gasoline, diesel, natural gas, coal, etc.), even when they are used for similar purposes. For example, the effective tax rate on diesel for road use is typically lower than the rate on gasoline, whether measured in terms of energy or CO2 emissions. The difference in the effective tax rate per unit of energy for gasoline and diesel for selected OECD countries is set out in the graph below.
Effective tax rates on gasoline vs. diesel (per unit of energy) in selected countries:

OECD (2013),Effective tax rates on energy: Gasoline vs. diesel (road use), in Taxing Energy Use, OECD Publishing.
Statlink to complete graph: http://dx.doi.org/10.1787/888932765674
Country notes
Results of the cross-country analysis, and background on the methodology used, are set out in the Overview section of the report.
A compilation of effective tax rates on major fuels and uses for each country is set out in Annex B of the report.
Links to the profile of energy use and taxation for each OECD country, with the country graphs, are set out below.
|
|
|
|
|
|
Further reading
- Effective Carbon Rates: Pricing CO2 through Taxes and Emissions Trading Systems (2016)
- OECD's work on tax and the environment
- Environmental taxation
- Inventory of Estimated Budgetary Support and Tax Expenditures for Fossil Fuels 2013
- OECD-IEA Fossil Fuel Subsidies and Other Support
Contact
› For more information, please e-mail: ctp.contact@oecd.org
› Stay tuned on Twitter: @OECDtax 
Related Documents


