Investissement
Foreign Direct Investment Statistics: Data, Analysis and Forecasts
|
FDI in 2023

|
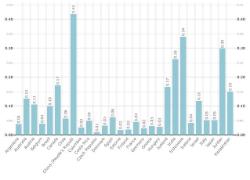
Global FDI flows declined in 202330/04/2024 - In 2023, global FDI flows dropped by 7%, to USD 1 364 billion, maintaining their downward trajectory and remaining below pre-pandemic levels for the second year in a row.[1] In 2023, FDI inflows decreased in more than two-thirds of OECD economies; nevertheless, significant drops in other economies also played a role in the total downturn. [1] By definition, inward and outward FDI worldwide should be equal but, in practice, there are statistical discrepancies between inward and outward FDI. Unless otherwise specified, references to ‘global FDI flows’ refer to the average of these two figures.
|

|
In focus
Trends, investor types and drivers of renewables energy FDI, OECD Working Papers on International Investment, Polina Knutsson and Perla Ibarlucea Flores, 2022 Divestments by MNEs: What do we know about why they happen?, Maria Borga and Monika Sztajerowska, 2018
Trade, FDI and global value chains
International trade and FDI are the main defining features and key drivers of global value chains. For the first time ever, these statistical notes for OECD countries provide evidence on the role played by investment in global value chains.
|
|
FDI regulatory restrictiveness index
The FDI Regulatory Restrictiveness Index (FDI Index) measures statutory restrictions on foreign direct investment in 58 countries, including all OECD and G20 countries, and covers 22 sectors.
|
|
FDI statistics database
Access the data on OECD.Stat (categorised under "Globalisation")
Access metadata underlying FDI statistics by partner country and by industry for OECD countries The new FDI statistics database covering FDI statistics from 2014 onwards went online in March 2015. Full list of frequently requested data found on the FDI statistics databaseContent and structure of the FDI statistics database according to BMD4
|
OECD benchmark definition (BMD4)
The FDI statistics database uses data compiled with "BMD4"- The 4th edition of the OECD Benchmark definition of FDI (BMD4) provides operational guidelines on how foreign direct investment activity should be measured and sets the world standard for collecting direct investment statistics. How BMD4 impacts our compilation of FDI statistics
Brochure on the major changes introduced by BMD4
Note on the FDI statistics database according to BMD4
Explanatory notes on OECD FDI statistics
|
|
|
Data collection calendar
Aggregate FDI statistics are updated quarterly, four months after the end of the reference quarter and revisions to earlier periods.
Detailed FDI statistics by partner country and by industry are updated annually, in the second half of December of the year after the reference year and incorporate revisions to earlier periods.
|
Documents and links
Trends, investor types and drivers of renewables energy FDI, OECD Working Papers on International Investment, 2022 Divestments by MNEs: What do we know about why they happen?, 2021 Drivers of divestment decisions in multinational enterprises, 2020 The determinants of Foreign Direct Investment - Do statutory restrictions matter?, 2019 The digital economy, multinational enterprises and international investment policy, 2018 Towards an international framework for investment facilitation, 2018 Examen des statistiques d'investissements directs internationaux au Maroc, 2018 |
Please find here (link to excel tables) the latest official FDI statistics for Q1 2022 as published by official national sources by the end of June 2022. Data for Q2 2022 will be published separately by national authorities by the end of September 2022, and released at the end of October 2022 in the OECD FDI database.
Documents connexes