

|
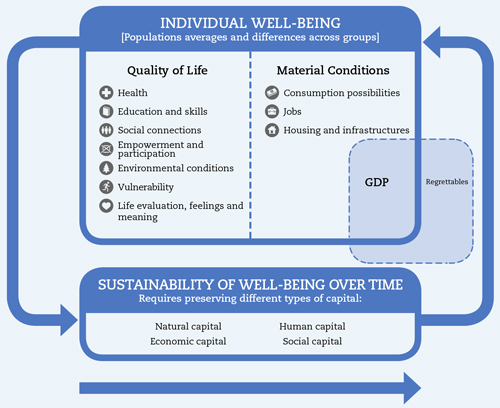
Development involves more than simple improvement in incomes or other material conditions. In its broadest terms, development can be thought of as a sustainable improvement in the well-being of a country’s citizens. Neglect of the broader dimensions of well-being in development policies is likely to impair their effectiveness, in part because it could lead to overlooking the social and political consensus which is indispensable for the pursuit of these goals. The How’s Life? framework (OECD, 2011) was designed with developed countries in mind, but its general structure is also relevant for developing nations. Current well-being is described in terms of 11 dimensions covering both the material living conditions and the quality of life that people experience. These dimensions are intended to be both conceptually distinct (i.e . they capture fundamentally different aspects of well-being) and, taken collectively, comprehensive (i.e. they capture all the important aspects of well-being). Thematically, these dimensions of well-being can be seen as grounded in the capabilities that individuals have to transform resources into given ends (sen, 1998). Discover the level of well being for each country below → |
 |
Côte d'Ivoire
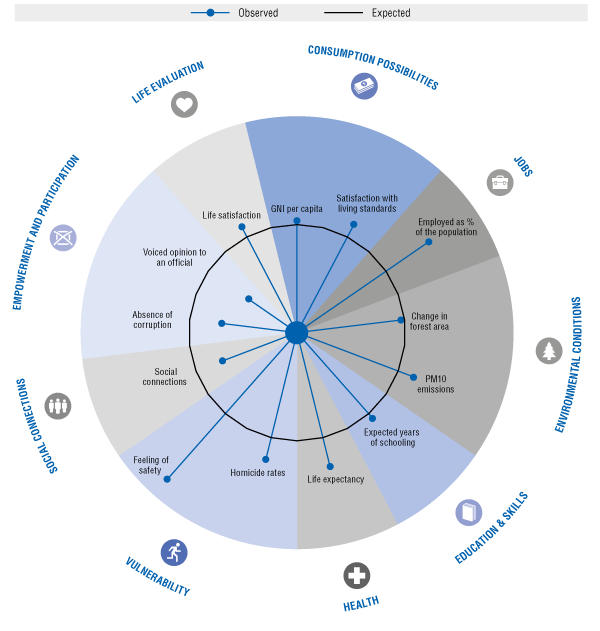
Past economic growth has not been sufficiently sustainable for the country to achieve emergence. Robust growth during the “Ivorian miracle” years (1960-70) was followed by a long period of economic decline. Per capita gross domestic product (GDP) doubled between independence in 1960 and the end of the 1970s. But 15 years later, in the mid-1990s, it receded to its 1960 level and it stagnated at this level until the recent revival. Economic growth has resumed since 2011, but has not translated into an increase in people’s well-being. The economy bounced back following the end of the conflict; from a 4.4% contraction of GDP in 2011 to an annual growth of about 10%, comparable to the post-independence days. This has helped to restore much-needed confidence in the economy and in Ivorian businesses. But strong economic growth has not translated into a rise in public well-being. Public satisfaction with living conditions diminished considerably in the post-election crisis period, and has profoundly affected the quality of life for Ivorians. Côte d’Ivoire’s level of life satisfaction consequently remains weak. The Ivorian authorities have demonstrated the political will to revive growth, this time of a more equitable and sustainable nature, and are aiming for emergence by 2020.
This figure is based on running bivariate regressions where the indicator is the dependent variable and GDP per capita is the independent variable. The expected value of each indicator is then computed by taking the coefficient of the bivariate regression and applying it to the actual GDP per capita of the country. The country’s observed results are then compared to the expected value for each indicator. The difference between the fitted values and the observed values is standardised by the standard deviation of the indicator. Standardising the size of the gap highlights those dimensions in which the performance of the country stands out. Expected values are calculated using all countries with a population over 1 million.
©OECD
Kazakhstan
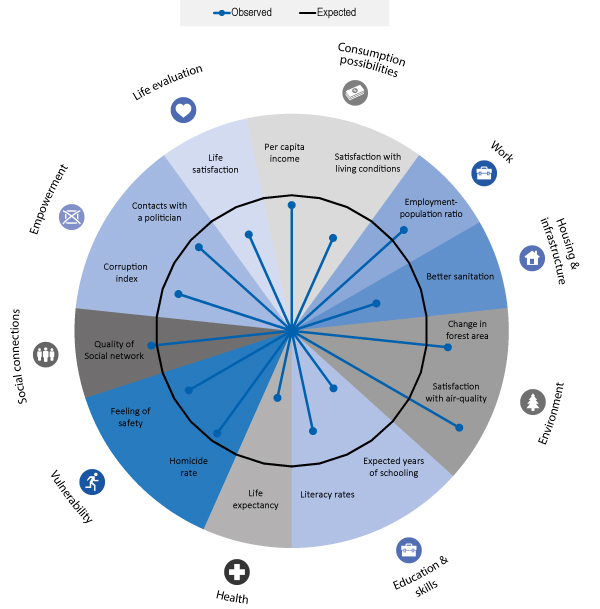
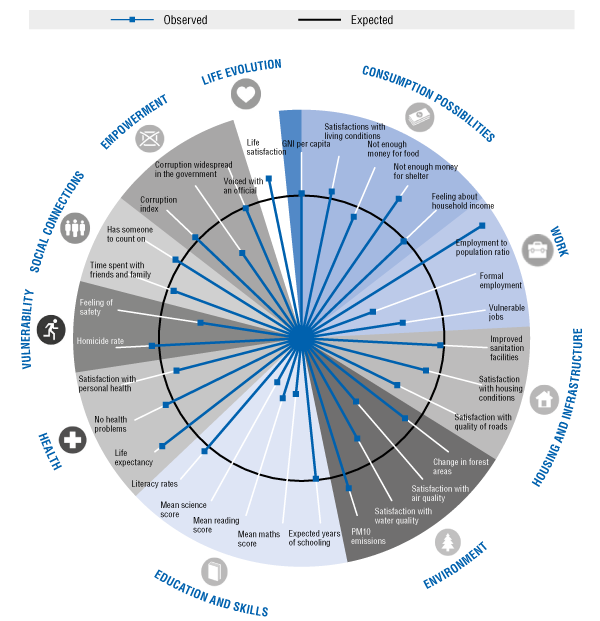
Despite significant progress since 2000, most well-being outcomes are below what could be expected from a comparable country at the same level of economic development. The figure shows measures of performance for Kazakhstan on the different dimensions of the well-being framework compared to a regression-based synthetic benchmark with the same level of GDP per capita. All indicators are normalised so that indicators above the reference line reflect better performance than the benchmark and indicators below the reference line reflect worse performance than the benchmark. The benchmarking tool gives an overview of the country’s relative performance along the ten well-being dimensions by comparing absolute and fitted values of 25 indicators. Kazakhstan is compared to all countries with more than 1 million inhabitants and covered in each indicator (according to data availability).
This figure is based on running bivariate regressions where the indicator is the dependent
variable and GDP per capita is the independent variable. The expected value of each indicator is
then computed by taking the coefficient of the bivariate regression and applying it to the actual
GDP per capita of the country. The country’s observed results are then compared to the expected
value for each indicator. The difference between the fitted values and the observed values is
standardised by the standard deviation of the indicator. Standardising the size of the gap
highlights those dimensions in which the performance of the country stands out. Expected values
are calculated using all countries with a population over 1 million.
©OECD
Maroc
Le bien-être des citoyens marocains affiche un bilan mitigé. L’OCDE a développé un cadre de mesure du bien-être qui a été appliqué au cas du Maroc. Les indicateurs relatifs aux possibilités de consommation, au degré de vulnérabilité et à la satisfaction à l’égard de la vie présentent des performances supérieures, voire largement supérieures, à celles attendues compte tenu du niveau de développement du pays. En revanche, la qualité des liens sociaux, l’emploi, la santé et surtout l’éducation, sont des dimensions dans lesquelles le Maroc enregistre de mauvaises performances. Dans les autres domaines, les résultats sont contrastés et varient en fonction des indicateurs concernés.
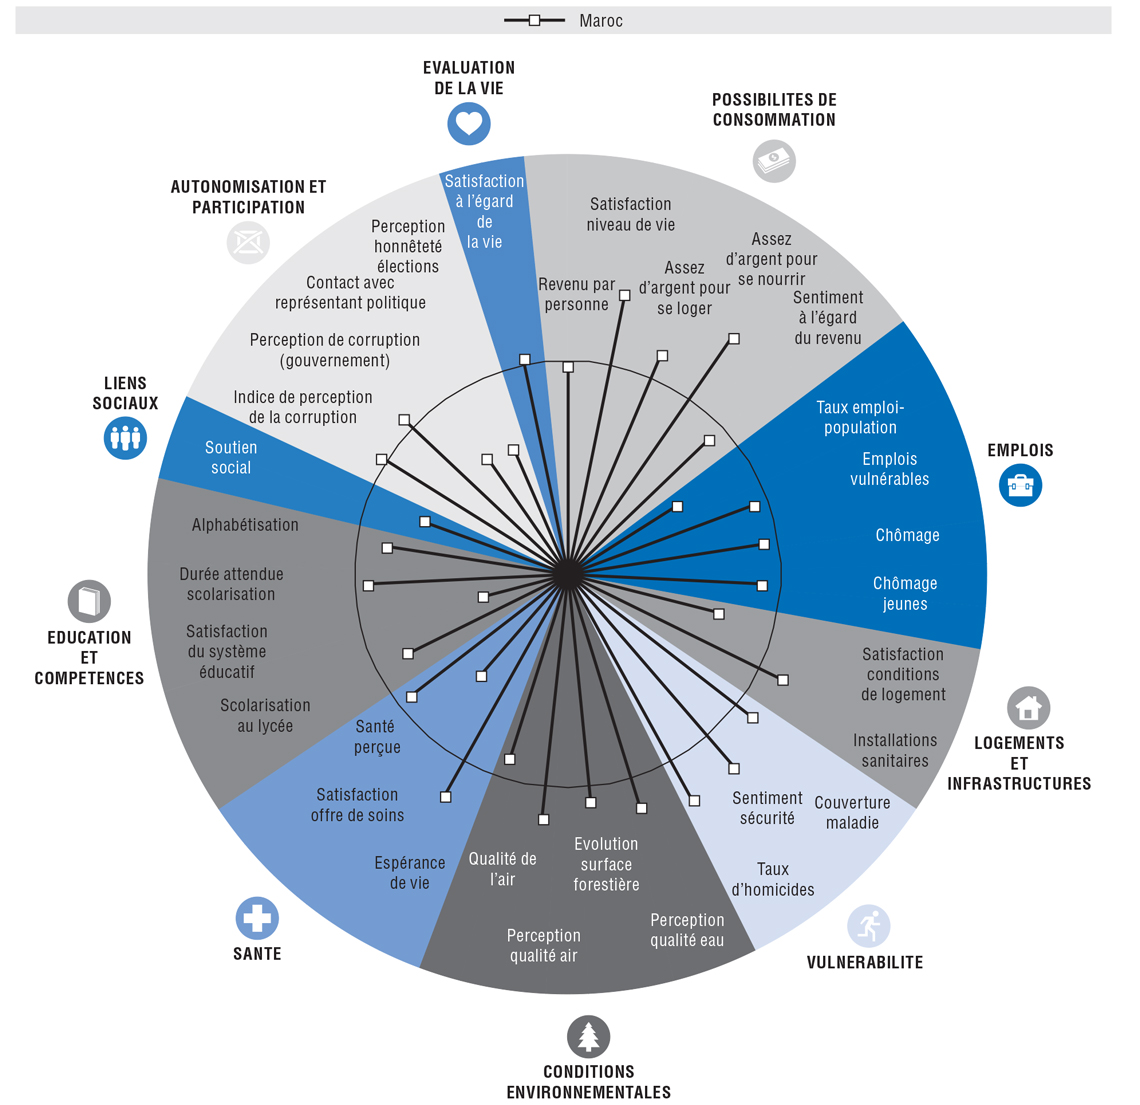
This figure is based on running bivariate regressions where the indicator is the dependent variable and GDP per capita is the independent variable. The expected value of each indicator is then computed by taking the coefficient of the bivariate regression and applying it to the actual GDP per capita of the country. The country’s observed results are then compared to the expected value for each indicator. The difference between the fitted values and the observed values is standardised by the standard deviation of the indicator. Standardising the size of the gap highlights those dimensions in which the performance of the country stands out. Expected values are calculated using all countries with a population over 1 million.
©OECD
Myanmar
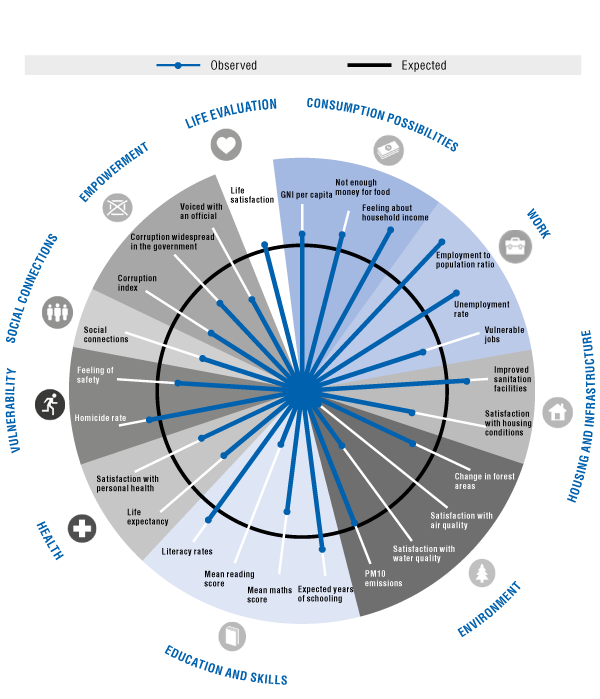
As a developing nation, well-being is generally low in Myanmar when considered in absolute terms. This cuts across all the outcomes considered in this report. However, of greater relevance for Myanmar’s development are the strengths and weaknesses of Myanmar when compared to how the country might be expected to perform given its level of economic development. In this respect the profile of Myanmar is somewhat uneven. Myanmar’s human capital stock, as represented by employment, health, and education outcomes is somewhat better than might be anticipated. In addition, female outcomes are similar to, or even better than, male outcomes across most of these areas. This is consistent with a society that places a high value on education.
This figure is based on running bivariate regressions where the indicator is the dependent variable and GDP per capita is the independent variable. The expected value of each indicator is then computed by taking the coefficient of the bivariate regression and applying it to the actual GDP per capita of the country. The country’s observed results are then compared to the expected value for each indicator. The difference between the fitted values and the observed values is standardised by the standard deviation of the indicator. Standardising the size of the gap highlights those dimensions in which the performance of the country stands out. Expected values are calculated using all countries with a population over 1 million.
©OECD
Peru
When it comes to well-being, Peru has areas of strengths and weaknesses. Peru performs reasonably well in the areas of consumption possibilities, social connections and life evaluations, but it underperforms in the areas of work, education and skills, and health. These latter areas are also characterised by remarkable inequalities across socio-demographic groups. Peru also displays weaknesses in terms of housing and infrastructure, environmental conditions, vulnerability, and empowerment and participation.
This figure is based on running bivariate regressions where the indicator is the dependent
variable and GDP per capita is the independent variable. The expected value of each indicator is
then computed by taking the coefficient of the bivariate regression and applying it to the actual
GDP per capita of the country. The country’s observed results are then compared to the expected
value for each indicator. The difference between the fitted values and the observed values is
standardised by the standard deviation of the indicator. Standardising the size of the gap
highlights those dimensions in which the performance of the country stands out. Expected values
are calculated using all countries with a population over 1 million.
©OECD
Sénégal
Le niveau de consommation des ménages ressort comme l’une des principales faiblesses du pays en matière de bien-être, et la dynamique depuis 2005 montre une aggravation de la pauvreté. Le pouvoir d’achat des Sénégalais reste très faible : 38 % de la population vivait dans l’extrême pauvreté en 2011, avec moins de 1.90 USD par jour (ANSD, 2011). L’éducation apparaît comme l’autre grande faiblesse du pays en matière de bien-être, avec des performances qui se sont dégradées depuis 2005. Le système éducatif ne permet pas de relever le niveau du capital humain, dont la faiblesse tire vers le bas la qualité de vie des Sénégalais. À l’inverse, les performances du Sénégal sont plus satisfaisantes dans le domaine des liens sociaux. Le réseau social est particulièrement solide au Sénégal et joue un rôle d’amortisseur et de facilitateur dans la recherche d’un emploi, mais aussi pour recevoir des soutiens financiers.
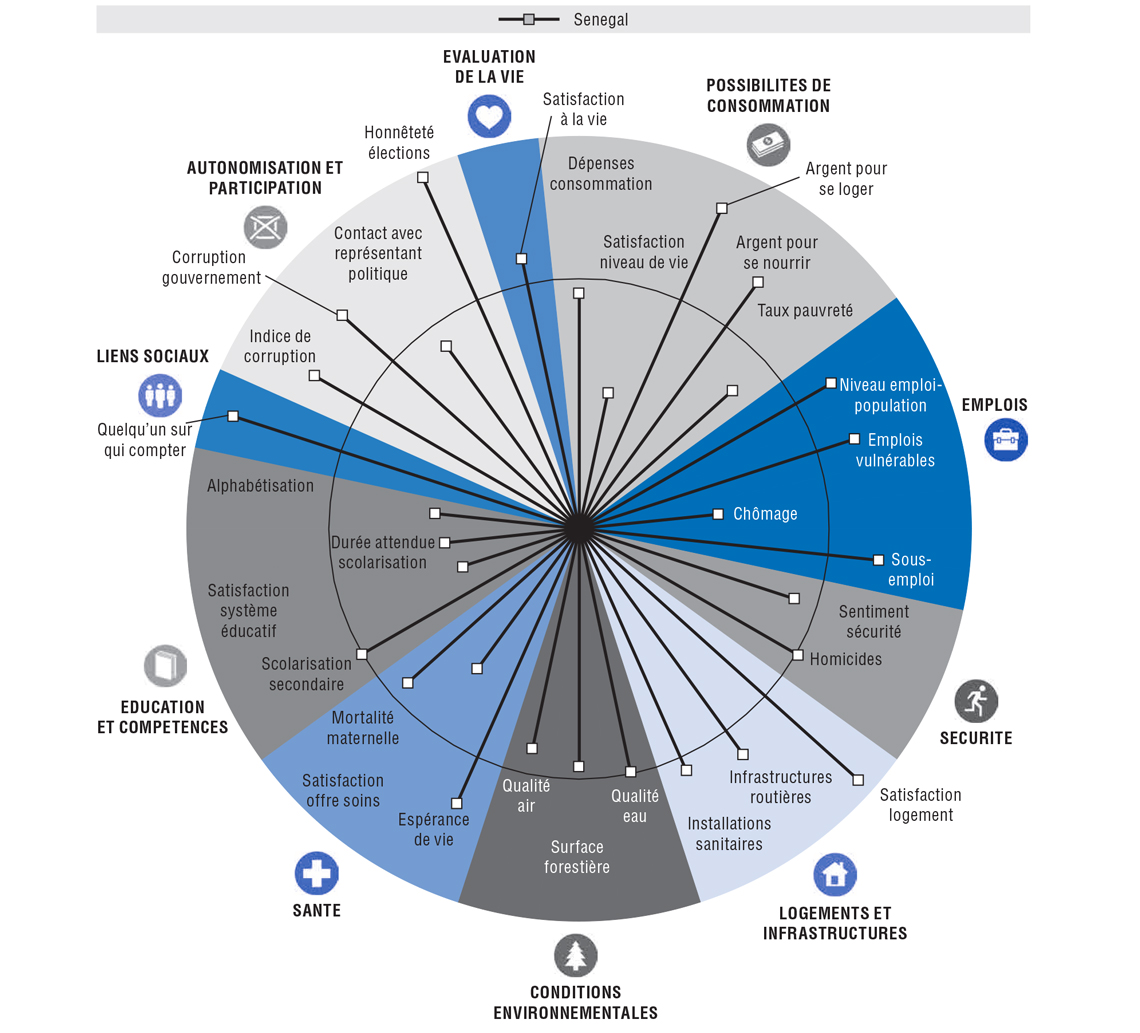
This figure is based on running bivariate regressions where the indicator is the dependent variable and GDP per capita is the independent variable. The expected value of each indicator is then computed by taking the coefficient of the bivariate regression and applying it to the actual GDP per capita of the country. The country’s observed results are then compared to the expected value for each indicator. The difference between the fitted values and the observed values is standardised by the standard deviation of the indicator. Standardising the size of the gap highlights those dimensions in which the performance of the country stands out. Expected values are calculated using all countries with a population over 1 million.
©OECD
Uruguay
In recent years, Uruguay has made remarkable progress in strengthening its macroeconomic management and improving its people’s well-being. The recovery from the Argentinian and Uruguayan crisis in 2001-02 saw the country begin its most extended period of economic growth. For most of the 2001-10 decade, stable macroeconomic policies and the favourable external environment allowed for solid growth and counteracted the devastating effects of the crisis. This is reflected in improvements in different dimensions of well-being. The country’s achievements are remarkable both by regional and OECD standards. As one of the few high-income countries in Latin America, and with the lowest levels of poverty and income inequality on the continent, Uruguay scores highly in areas such as life satisfaction, environmental quality, health, trust, perception of government and air quality. Nevertheless, some challenges remain, including unequal access to education (particularly secondary), youth unemployment and social exclusion.
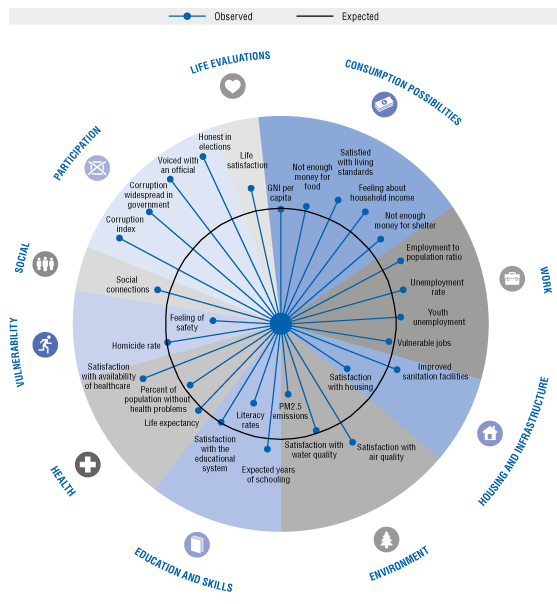
This figure is based on running bivariate regressions where the indicator is the dependent
variable and GDP per capita is the independent variable. The expected value of each indicator is
then computed by taking the coefficient of the bivariate regression and applying it to the actual
GDP per capita of the country. The country’s observed results are then compared to the expected
value for each indicator. The difference between the fitted values and the observed values is
standardised by the standard deviation of the indicator. Standardising the size of the gap
highlights those dimensions in which the performance of the country stands out. Expected values
are calculated using all countries with a population over 1 million.
©OECD