West African Futures 2011-12: Settlement, market and food security
 |
The 2011-12 West African Futures (WAF) programme focused on the spatial, economic and social consequences of settlement and market dynamics on food security. Capitalising on this two-year work, the final study provides policy makers and key stakeholders with a description of food security challenges that need to be addressed in regional policy and strategy design. In particular, it highlights the importance of coherent and regionally harmonised statistics in improving West African agricultural and food strategies. The programme also demonstrates how the failure to account for unrecorded regional trade in agricultural products considerably biases analyses of food security. Key findings were discussed with West African policy makers at the SWAC Forum; training workshops were held at the UEMOA headquarters. Data can be visualised within the Statistical Mapping and Analytical Regional Tool (SMART) which allows you to map, follow and compare key settlement data for the 17 West African countries and country groups between 1950 and 2050. Throughout 2013, the SWAC Secretariat pursued efforts to share and discuss key findings in West Africa and international settings. |  |
|

At a glance
|
Presentation of the programme |
Expected results |
Impact of settlement dynamics |
Information sheets
Data visualisation - SMART
 |
Statistical, Mapping and Regional Analysis Tool (SMART) The data produced by the programme is accessible online within the Statistical, Mapping and Regional Analysis Tool (SMART), launched in April 2013. This interactive tool allows users to map, graph and compare 40 different indicators for the 17 countries of the region and eight sub-regional groupings. SMART also offers the possibility to cross-analyse settlement data and agricultural performance, providing alternative ways of interpreting past trends and assessing future potential. The population and settlement data cover the period from 1950 to 2050. The data and maps can easily be downloaded. |
Meetings of the Working Group and Forum
A Working Group composed of key stakeholders was at the centre of the entire process. It drew on existing work conducted by Members and other institutions, and provided inputs and guidance on work priorities. West African statisticians also participated in training workshops to learn more about alternative methods such as spatial modelling in order to fill the data gap. Some key findings and policy options from the WAF study were presented and discussed at the SWAC Forum.
- First working group meeting, OECD headquarters, 17 March 2011
- SWAC Forum on agricultural and food price volatility, OECD headquarters, 14 June 2011
- Second working group meeting, OECD headquarters, 27-28 October 2011
- Technical workshop, Ouagadougou, 15-16 February 2012
- Technical workshop on demo-economic and spatial modelling, Ouagadougou, 4-5 December 2012
- SWAC Forum on Settlement, market and food security, Ouagadougou, 7 December 2012
Policy dialogue & Oucomes
Throughout 2013, the SWAC Secretariat shared and discussed results from the 2011-12 WAF programme in West Africa and international settings. These occasions served to introduce key findings at conferences and workshops, to share data and methodology with on-going foresight programmes on the future of food security in West Africa and to inform policy and development programme formulation.
More than 500 e-book copies have been downloaded from the OECD I-library. Some 1 000 copies were disseminated by the SWAC Secretariat to West African policymakers, development partners and other target audiences.
- Key findings and analyses from the WAF programme fed into the formulation of the AGIR Regional Roadmap, emphasising a comprehensive interpretation of market dynamics and the importance of urbanisation and settlement patterns in food and nutritional strategies;
- Discussions on integrating Africapolis data in food security early warning and other spatial population measurement tools have already started, notably with USAID/FEWS NET;
- WAF analyses were extensively referenced in the Australian Aid’s food security programme for West Africa.
Follow-up 2014: Africapolis - updated urbanisation data
Having demonstrated the crucial importance of urbanisation and settlement data in the field of food security policy formulation, the SWAC Secretariat worked together with the Africapolis team on an up-date of the “West African urbanisation dynamics” study. This updated study, to be published in Mid-2014, integrates new census data from 13 countries. It identifies and geolocalises 2 965 agglomerations (versus 1 582 in 2008), of which 1 366 are located in Nigeria, providing the most extensive database on Nigerian urbanisation to date.
Did you know?
- Between 1950 and 2010, the total population of West Africa grew from 72 to 290 million inhabitants.
- The demographic transition in West Africa is accompanied by a significant spatial redistribution of populations.
- Over the past six decades, the urban population multiplied by 20, from 6 million to 118 million inhabitants, and the level of urbanisation grew from 8% to 41%.
- During the same period, the rural population multiplied by 2.6, from 66 million to 172 million, and rural population densities increased.
- Agricultural production between 1980 and 2010 saw an average annual growth of 3.7% compared to the world average of 2.21%.
- Imports, as a share of total food availability, are stable.
- Higher yields account for 40% of the increase in production between 1980 and 2007.
- The prevalence of undernourishment has declined by 44% since 1990, but 33 million West Africans still remain undernourished.
Urbanisation
"The network of cities dictates the spatial organisation of markets by serving as the connective tissue between rural and urban areas. They act as exchange platforms for agricultural and rural output, as stimulators of rural non-farm activity, as places for seasonal job opportunities for farmers, and as facilitators of economies of scale. Therefore, urbanisation takes on multiple forms and operates at different rates in relation to economic and social development."
|
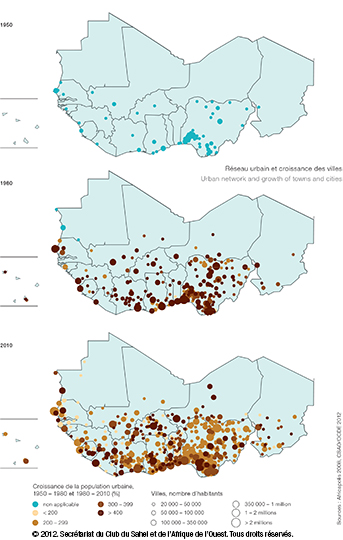
Urban network and growth of towns and cities |
Rural population
|
Rural population (2000)
|

Statistics
- West Africa has not completed its demographic transition. Between 1950 and 2010, the population increased from 72 to 290 million inhabitants.
- The number of urban dwellers has risen by a factor of 20, from 6 to 118 million inhabitants. In 1950, no country in the region had a level of urbanisation greater than 20%; in 2010, eight countries had a level of urbanisation close to 50%. These trends have led to profound changes in agricultural geography, market dynamics, incomes and thus food security.
- Reassessing the impact of agricultural transformations: The rural economy is changing. Reliable information on agricultural and non-agricultural populations, as well as their ratios, would illustrate geographic and social changes and the relationship between food demand and supply. Available statistics do not provide an accurate sense of the scale of this change. Rural populations are often likened to agricultural producers and urban populations to consumers. As a result, the number of producers is overestimated, their geographic distribution incorrect and their productivity underestimated.
- Understanding the impact of the informal economy: The majority of non-food producing consumers are comprised of urban dwellers that derive their income from the informal sector. Most of these urban dwellers lack the income needed to purchase the goods produced and marketed by the modern (formal) economy. Consequently, the food consumed is supplied by “informal networks”, which are poorly monitored by national accounting systems. Despite its major significance, the informal economy remains imprecisely defined and poorly measured. As a result, it is largely neglected in food security policies.
Related Documents