Statistics and Data Directorate
Composite Leading Indicators (CLI) Frequently Asked Questions (FAQs)
1. What is a CLI?: watch "Understanding Composite Leading Indicators"
2. How to compare the CLI and the GDP (the reference series)?
3. Why is the CLI revised? How often is it revised? How large are the revisions?
5. Where can I download CLI data?
6. Why does the trend restored CLI lag behind?
7. Why can I no longer find "annualised 6-month rates of change" indicators?
8. What are the components of the CLI?
9. What are the historical turning points of the IIP/GDP?
10. How are the CLIs for zones calculated? What are the weights?
11. What is the λ parameter value for the double Hodrick-Prescott filter (12 months - 120 months)?
The OECD system of Composite Leading Indicators (CLIs) is designed to provide early signals of turning points in business cycles - fluctuation in the output gap, i.e. fluctuation of the economic activity around its long term potential level. This approach, focusing on turning points (peaks and troughs), results in CLIs that provide qualitative rather than quantitative information on short-term economic movements.
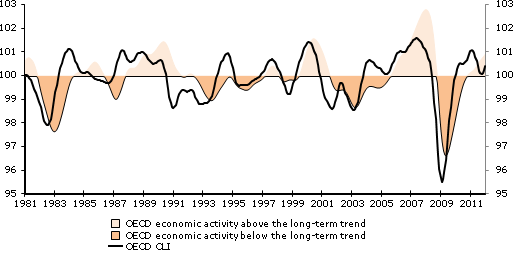
The phases and patterns in CLIs are likely to be followed by the business cycle. The chart below presents the CLI and the estimated business cycle for the OECD area. The two series show strong co-movements, with the turning points of the CLI consistently preceding those of the business cycle; lead time varies, but 6 - 9 months is at what the OECD aims.
|
OECD area Composite Leading Indicator (CLI) and economic activity |
|
|
Our short video can also help you understand CLIs
2. How to compare the CLI and the GDP (the reference series)?
The CLIs can be presented in various forms. For each form of the CLI there is a corresponding form of the reference series. The preferred form of the CLI for OECD is the amplitude adjusted. This form is used for the lead time optimization, and as a consequence this is the form presented in OECD CLI publications. Nonetheless users may prefer to use other forms, so OECD provides them also.
The amplitude adjusted CLI should be compared to the de-trended reference series: the CLI is the average of de-trended and smoothed component series, and similarly the reference series is also de-trended and smoothed. The amplitude adjusted CLI rescales this 'averaged' CLI to match the amplitudes of the de-trended reference series.
The trend restored CLI should be compared to the original reference series: the trend restored CLI reflects the product of the trend of the reference series (in index form or natural units) and the amplitude adjusted CLI. This transformation of the CLI facilitates analyses of trend cycles or classic business cycles.
The 12-month rate of change of the CLI should be compared to the similar reference series: the 12-month rate of change series are calculated from the trend restored CLI. Some analysts prefer this depiction since the reference series is most often published in this format by national statistical offices.
3. Why is the CLI revised? How often is it revised? How large are the revisions?
Revisions are a natural phenomenon for the CLIs. In order to isolate cyclical patterns, component series have to pass through several filters (seasonal adjustment, outlier detection, de-trending, smoothing, normalization). All these filters operate on the whole time series and generate revisions of the CLIs. The filters causing the largest revisions are the de-trending and smoothing filters.
Furthermore, during the aggregation process, a 60% threshold of component availability is applied. This means that for any given period, a CLI is already calculated if data for 60% or more of the component series are available in that period. Component availability may improve after the first release. This variation in availability will therefore cause revision (especially at the end of the series).
As CLIs are computed every month, they are subject to revision once a month.
To see how large and how often the CLIs are revised, one may refer to the document "Current period performance of OECD Composite Leading Indicators", 2007. The results of the study show that the first releases of CLIs are revised frequently but with a size of the revision rather small. This study was dealing with the Phase Average Trend method for detrending and smoothing the series.
The paper "Cycle extraction: A comparison of the Phase-Average Trend method, the Hodrick-Prescott and Christiano-Fitzgerald filters"(pdf) (2008) reports on revision properties of different de-trending and smoothing methods (cycle estimation methods), including PAT with MCD smoothing, a double Hodrick-Prescott (HP) filter and the Christiano-Fitzgerald (CF) filter. The study shows revision patterns caused by de-trending in terms of size, biais and turning points signal stability.
The OECD Main Economic Indicators Original Release Data and Revisions Database interface provides consecutive vintages of CLIs as originally published in each monthly edition of the MEI, from February 1999 onwards: https://stats.oecd.org/index.aspx?queryid=57151.
The OECD CLIs are compiled and published on a monthly basis. The schedule of CLI updates can be found by clicking on this agenda.
5. Where can I download CLI data?
CLI can be downloaded from the dataset "Composite Leading Indicators (MEI)" in OECD.Stat . In OECD.Stat Extracts you can modify the current data selection by using the top navigation bar to select specific "Subject", "Country" and "Time & Frequency". The data can be exported to Excel. For long time series we recommend using the text format. You may also consult the OECD.Stat Extracts' user guide.
6. Why does the trend restored CLI lag behind?
The trend restoration of the CLI series is done by multiplying the raw CLI, which fluctuates around 100, by the trend of the reference series. The 12 month rate of change is calculated on the trend restoration CLI. The reference series used by the OECD is the GDP. The timeliness of the GDP is typically worse than those of CLI input series as GDP is only available on a quarterly basis. This means that when computing a CLI, if data for GDP is missing, its trend cannot be extracted from the raw GDP and so the trend restored CLI and the 12 month rate of change cannot be calculated (although the raw or the amplitude adjusted CLI is already calculated).
Access the calendar for OECD quarterly GDP release dates (xls)
Access the calendar for OECD CLI release dates
For further details on the methodology please refer to the OECD CLI methodology (pdf).
7. Why can I no longer find "annualised 6-month rates of change" indicators?
As it has been highlighted on the OECD website in November 2008, the OECD has modified the way of calculating its CLIs. At this stage, the 6-month rate of change series have been suppressed and replaced by 12 month rate of change series for direct comparability with year-on-year changes of the IIP. For further details, please refer to the document: "Upcoming changes to the OECD Composite Leading Indicators to be implemented in the December 2008 MEI" (pdf).
8. What are the components of the CLI?
The components of the CLI are time series which exhibit leading relationship with the reference series (GDP) at turning points. The component series for each country are selected based on various criteria such as economic significance; cyclical behavior; data quality; timeliness and availability. To get the list of component series for each country click here.
9. What are the historical turning points of the IIP/GDP?
Up to April 2012 the main reference series used in the OECD CLI system for the majority of countries was the Index of Industrial Production (IIP) covering all industry sectors excluding construction. Starting from April 2012 the OECD CLI system is using GDP as the reference series except for China.
For the chronology of turning points in the reference series for regional/zone aggregates and individual countries click here.
The detailed definition of a turning point can be found in the CLI glossary at www.oecd.org/std/cli/glossary.
10. How are the CLIs for zones calculated? What are the weights?
The zones are annually chain-linked Laspeyres indices where the country weights, for each individual link are the previous year’s gross domestic product based on Purchasing Power Parity (PPP) valuation of country GDP, in billions of current international dollar. Weights between 1955 and 1981 refer to the GDP PPP value in 1980. The country average values, are calculated as the average of the country’s indicator from the previous year. The linking point is February of each year. A zone aggregate is calculated if the overall weight of the available components is greater than 60%. Iceland is excluded from zone calculations since no CLI is published for this country.
The source of the weights data is the International Monetary Fund’s World Economic Outlook (WEO) database.
More detailed information is available in the CLI zone aggregation methodology document (pdf) and in the list of zones and their country composition on the OECD website. For weights for aggregating zone click here.
11. What is the λ parameter value for the double Hodrick-Prescott filter (12 months - 120 months)?
In the OECD CLI methodology, the default settings allow to remove cyclical components that have a cycle length longer than 120 month and those that have a cycle length shorter than 12 months. They are equivalent of setting λ = 133107.94 and λ = 13.93 respectively.
Going from frequencies to λ parameter is achieved by substituting into the formula:
λ=[4(1-cos(ω0))2]-1. Whereas ω0 is the frequency expressed in radians, and τ denotes the number of periods it takes to complete a full cycle. The two parameters are related through ω0=2π/τ. So the λ values above correspond to τ=120 months and τ=12 months.
Related Documents